 The Town Files
25 Small Towns in Oklahoma With the Mildest Winters
Ranked by january average low (°f) among 86 towns of 500–10,000 people in Oklahoma. #1 is Lone Grove, OK (January lows average 31.5°F).
-
25Frederick, Oklahoma
January lows average 27.9°F
Frederick is a city of 3,468 people in Tillman County, Oklahoma. January lows average 27.9°F and July highs 96.7°F, with about 108 days a year at 90°F+ and 2 inches of snow.
3,468 people · Tillman County · median home $89,300 · income $44,595 · Jan low 28°F · 2 in snow
Full Frederick, Oklahoma profile: weather, storms, schools, jobs →
NOAA 1991–2020 normals, Tipton 4S Mesonet station. -
24Elgin, Oklahoma
January lows average 27.9°F
Elgin is a city of 3,656 people in Comanche County, Oklahoma. January lows average 27.9°F and July highs 95.9°F, with about 83 days a year at 90°F+ and 3 inches of snow.
3,656 people · Comanche County · median home $260,700 · income $96,250 · Jan low 28°F · 3 in snow
Full Elgin, Oklahoma profile: weather, storms, schools, jobs →
NOAA 1991–2020 normals, Lawton station. -
23Sulphur, Oklahoma
January lows average 27.9°F
Sulphur is a city of 5,065 people in Murray County, Oklahoma. January lows average 27.9°F and July highs 93.1°F, with about 73 days a year at 90°F+ and 2 inches of snow.
5,065 people · Murray County · median home $122,000 · income $66,957 · Jan low 28°F · 2 in snow
Full Sulphur, Oklahoma profile: weather, storms, schools, jobs →
NOAA 1991–2020 normals, Chickasaw Nra station. -
22Sallisaw, Oklahoma
January lows average 27.9°F
Sallisaw is a city of 8,510 people in Sequoyah County, Oklahoma. January lows average 27.9°F and July highs 91.4°F, with about 61 days a year at 90°F+ and 2 inches of snow.
8,510 people · Sequoyah County · median home $134,100 · income $48,036 · Jan low 28°F · 2 in snow
Full Sallisaw, Oklahoma profile: weather, storms, schools, jobs →
NOAA 1991–2020 normals, Sallisaw 2 Nw station. -
21Turley, Oklahoma
January lows average 28.0°F
Turley is a community of 2,607 people in Tulsa County, Oklahoma. January lows average 28.0°F and July highs 93.6°F, with about 74 days a year at 90°F+ and 9 inches of snow.
2,607 people · Tulsa County · median home $54,600 · income $42,298 · Jan low 28°F · 9 in snow
Full Turley, Oklahoma profile: weather, storms, schools, jobs →
NOAA 1991–2020 normals, Tulsa Intl Ap station. -
20Catoosa, Oklahoma
January lows average 28.0°F
Catoosa is a city of 7,440 people in Rogers County, Oklahoma. January lows average 28.0°F and July highs 93.6°F, with about 74 days a year at 90°F+ and 9 inches of snow.
7,440 people · Rogers County · median home $178,800 · income $72,467 · Jan low 28°F · 9 in snow
Full Catoosa, Oklahoma profile: weather, storms, schools, jobs →
NOAA 1991–2020 normals, Tulsa Intl Ap station. -
19Collinsville, Oklahoma
January lows average 28.0°F
Collinsville is a city of 7,881 people in Tulsa County, Oklahoma. January lows average 28.0°F and July highs 93.6°F, with about 74 days a year at 90°F+ and 9 inches of snow.
7,881 people · Tulsa County · median home $225,400 · income $90,570 · Jan low 28°F · 9 in snow
Full Collinsville, Oklahoma profile: weather, storms, schools, jobs →
NOAA 1991–2020 normals, Tulsa Intl Ap station. -
18Skiatook, Oklahoma
January lows average 28.0°F
Skiatook is a city of 8,450 people in Osage County, Oklahoma. January lows average 28.0°F and July highs 93.6°F, with about 74 days a year at 90°F+ and 9 inches of snow.
8,450 people · Osage County · median home $182,600 · income $57,480 · Jan low 28°F · 9 in snow
Full Skiatook, Oklahoma profile: weather, storms, schools, jobs →
NOAA 1991–2020 normals, Tulsa Intl Ap station. -
17Hobart, Oklahoma
January lows average 28.1°F
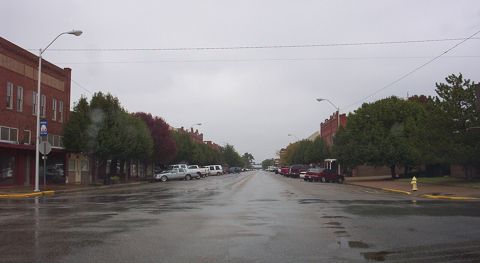
Photo: Treasa at English Wikipedia (public domain, Wikimedia Commons) Hobart is a city of 3,413 people in Kiowa County, Oklahoma. January lows average 28.1°F and July highs 96.8°F, with about 94 days a year at 90°F+ and 4 inches of snow.
3,413 people · Kiowa County · median home $71,100 · income $33,051 · Jan low 28°F · 4 in snow
Full Hobart, Oklahoma profile: weather, storms, schools, jobs →
NOAA 1991–2020 normals, Hobart Muni Ap station. -
16Coweta, Oklahoma
January lows average 28.1°F
Coweta is a city of 9,654 people in Wagoner County, Oklahoma. January lows average 28.1°F and July highs 94.0°F, with about 81 days a year at 90°F+ and 4 inches of snow.
9,654 people · Wagoner County · median home $205,700 · income $67,519 · Jan low 28°F · 4 in snow
Full Coweta, Oklahoma profile: weather, storms, schools, jobs →
NOAA 1991–2020 normals, Tulsa R L Jones Jr Ap station. -
15Checotah, Oklahoma
January lows average 28.2°F
Checotah is a city of 3,018 people in McIntosh County, Oklahoma. January lows average 28.2°F and July highs 92.3°F, with about 68 days a year at 90°F+ and 8 inches of snow.
3,018 people · McIntosh County · median home $124,900 · income $37,042 · Jan low 28°F · 8 in snow
Full Checotah, Oklahoma profile: weather, storms, schools, jobs →
NOAA 1991–2020 normals, Muskogee Davis Fld station. -
14Broken Bow, Oklahoma
January lows average 28.3°F
Broken Bow is a city of 4,228 people in McCurtain County, Oklahoma. January lows average 28.3°F and July highs 93.0°F, with about 81 days a year at 90°F+ and 2 inches of snow.
4,228 people · McCurtain County · median home $179,900 · income $39,895 · Jan low 28°F · 2 in snow
Full Broken Bow, Oklahoma profile: weather, storms, schools, jobs →
NOAA 1991–2020 normals, Broken Bow 1 N station. -
13Marlow, Oklahoma
January lows average 28.4°F
Marlow is a city of 4,385 people in Stephens County, Oklahoma. January lows average 28.4°F and July highs 93.5°F, with about 76 days a year at 90°F+ and 6 inches of snow.
4,385 people · Stephens County · median home $136,300 · income $56,655 · Jan low 28°F · 6 in snow
Full Marlow, Oklahoma profile: weather, storms, schools, jobs →
NOAA 1991–2020 normals, Duncan station. -
12Hugo, Oklahoma
January lows average 28.5°F
Hugo is a city of 5,166 people in Choctaw County, Oklahoma. January lows average 28.5°F and July highs 92.8°F, with about 73 days a year at 90°F+ and 1 inches of snow.
5,166 people · Choctaw County · median home $96,300 · income $33,917 · Jan low 29°F · 1 in snow
Full Hugo, Oklahoma profile: weather, storms, schools, jobs →
NOAA 1991–2020 normals, Antlers station. -
11Idabel, Oklahoma
January lows average 29.4°F
Idabel is a city of 6,961 people in McCurtain County, Oklahoma. January lows average 29.4°F and July highs 93.5°F, with about 80 days a year at 90°F+ and 2 inches of snow.
6,961 people · McCurtain County · median home $134,800 · income $43,295 · Jan low 29°F · 2 in snow
Full Idabel, Oklahoma profile: weather, storms, schools, jobs →
NOAA 1991–2020 normals, Idabel station. -
10Roland, Oklahoma
January lows average 29.6°F
Roland is a town of 3,316 people in Sequoyah County, Oklahoma. January lows average 29.6°F and July highs 94.1°F, with about 78 days a year at 90°F+ and 3 inches of snow.
3,316 people · Sequoyah County · median home $139,800 · income $51,754 · Jan low 30°F · 3 in snow
Full Roland, Oklahoma profile: weather, storms, schools, jobs →
NOAA 1991–2020 normals, Ft Smith Rgnl Ap station. -
9Pocola, Oklahoma
January lows average 29.6°F
Pocola is a town of 4,255 people in Le Flore County, Oklahoma. January lows average 29.6°F and July highs 94.1°F, with about 78 days a year at 90°F+ and 3 inches of snow.
4,255 people · Le Flore County · median home $151,100 · income $50,545 · Jan low 30°F · 3 in snow
Full Pocola, Oklahoma profile: weather, storms, schools, jobs →
NOAA 1991–2020 normals, Ft Smith Rgnl Ap station. -
8Poteau, Oklahoma
January lows average 29.6°F
Poteau is a city of 8,807 people in Le Flore County, Oklahoma. January lows average 29.6°F and July highs 94.1°F, with about 78 days a year at 90°F+ and 1 inches of snow.
8,807 people · Le Flore County · median home $157,400 · income $50,511 · Jan low 30°F · 1 in snow
Full Poteau, Oklahoma profile: weather, storms, schools, jobs →
NOAA 1991–2020 normals, Ft Smith Rgnl Ap station. -
7Tishomingo, Oklahoma
January lows average 29.7°F
Tishomingo is a city of 3,101 people in Johnston County, Oklahoma. January lows average 29.7°F and July highs 94.0°F, with about 77 days a year at 90°F+ and 2 inches of snow.
3,101 people · Johnston County · median home $110,600 · income $40,052 · Jan low 30°F · 2 in snow
Full Tishomingo, Oklahoma profile: weather, storms, schools, jobs →
NOAA 1991–2020 normals, Coleman 4W station. -
6Calera, Oklahoma
January lows average 29.8°F
Calera is a town of 2,916 people in Bryan County, Oklahoma. January lows average 29.8°F and July highs 94.1°F, with about 82 days a year at 90°F+ and 2 inches of snow.
2,916 people · Bryan County · median home $157,600 · income $64,449 · Jan low 30°F · 2 in snow
Full Calera, Oklahoma profile: weather, storms, schools, jobs →
NOAA 1991–2020 normals, Durant station. -
5Madill, Oklahoma
January lows average 29.8°F
Madill is a city of 3,914 people in Marshall County, Oklahoma. January lows average 29.8°F and July highs 95.0°F, with about 87 days a year at 90°F+ and 2 inches of snow.
3,914 people · Marshall County · median home $109,600 · income $47,522 · Jan low 30°F · 2 in snow
Full Madill, Oklahoma profile: weather, storms, schools, jobs →
NOAA 1991–2020 normals, Madill station. -
4Okemah, Oklahoma
January lows average 30.3°F
Okemah is a city of 3,074 people in Okfuskee County, Oklahoma. January lows average 30.3°F and July highs 93.0°F, with about 75 days a year at 90°F+ and 5 inches of snow.
3,074 people · Okfuskee County · median home $79,300 · income $32,386 · Jan low 30°F · 5 in snow
Full Okemah, Oklahoma profile: weather, storms, schools, jobs →
NOAA 1991–2020 normals, Okemah station. -
3Henryetta, Oklahoma
January lows average 30.3°F
Henryetta is a city of 5,640 people in Okmulgee County, Oklahoma. January lows average 30.3°F and July highs 93.0°F, with about 75 days a year at 90°F+ and 1 inches of snow.
5,640 people · Okmulgee County · median home $88,600 · income $45,259 · Jan low 30°F · 1 in snow
Full Henryetta, Oklahoma profile: weather, storms, schools, jobs →
NOAA 1991–2020 normals, Okemah station. -
2Cache, Oklahoma
January lows average 31.1°F
Cache is a city of 2,930 people in Comanche County, Oklahoma. January lows average 31.1°F and July highs 94.1°F, with about 84 days a year at 90°F+ and 2 inches of snow.
2,930 people · Comanche County · median home $162,700 · income $65,536 · Jan low 31°F · 2 in snow
Full Cache, Oklahoma profile: weather, storms, schools, jobs →
NOAA 1991–2020 normals, Medicine Pk 3W Mesonet station. -
1Lone Grove, Oklahoma
January lows average 31.5°F
Lone Grove is a city of 4,993 people in Carter County, Oklahoma. January lows average 31.5°F and July highs 95.3°F, with about 81 days a year at 90°F+ and 3 inches of snow.
4,993 people · Carter County · median home $204,900 · income $74,265 · Jan low 32°F · 3 in snow
Full Lone Grove, Oklahoma profile: weather, storms, schools, jobs →
NOAA 1991–2020 normals, Ardmore station.
More Oklahoma rankings
- The 23 Best Small Towns to Retire in Oklahoma
- The 10 Quietest Small Towns in Oklahoma
- The 25 Most Affordable Small Towns in Oklahoma
- The 25 Best Small Towns for Families in Oklahoma
- The 25 Most Walkable Small Towns in Oklahoma
- 25 Small Towns in Oklahoma With the Fewest Tornadoes Since 1950
- The 25 Best Small Towns for First-Time Home Buyers in Oklahoma
Same ranking, other places
- 50 Small Towns in America With the Mildest Winters
- 25 Small Towns in Pennsylvania With the Mildest Winters
- 25 Small Towns in New York With the Mildest Winters
- 25 Small Towns in Michigan With the Mildest Winters
- 25 Small Towns in Texas With the Mildest Winters
- 25 Small Towns in California With the Mildest Winters
- 25 Small Towns in New Jersey With the Mildest Winters
- 25 Small Towns in Florida With the Mildest Winters
- 25 Small Towns in Wisconsin With the Mildest Winters
- 25 Small Towns in Ohio With the Mildest Winters
- U.S. Census Bureau, American Community Survey 5-year estimates (2020–2024)
- U.S. Census Bureau, 2020 Census and 2025 Gazetteer (2020 / 2025)
- NOAA NCEI U.S. Climate Normals (1991–2020)
- NOAA NCEI Storm Events Database (1950–2026)
- FEMA OpenFEMA Disaster Declarations (this product uses the FEMA OpenFEMA API but is not endorsed by FEMA) (1953–2026)
- NCES Common Core of Data (2023–24)
- BLS Quarterly Census of Employment and Wages; USDA ERS county unemployment (BLS LAUS) (2000–2024)
- The Town Files lifestyle rankings, built from federal demographic, school, crime and housing data (2025)