 The Town Files
25 Small Towns in New Jersey With the Coolest Summers
Ranked by july average high (°f) among 352 towns of 500–10,000 people in New Jersey. #1 is Ventnor City, NJ (July highs average 80.3°F).
-
25Port Monmouth, New Jersey
July highs average 83.5°F
Port Monmouth is a community of 3,745 people in Monmouth County, New Jersey. January lows average 24.8°F and July highs 83.5°F, with about 13 days a year at 90°F+ and 27 inches of snow.
3,745 people · Monmouth County · median home $451,300 · income $104,135 · Jan low 25°F · 27 in snow
Full Port Monmouth, New Jersey profile: weather, storms, schools, jobs →
NOAA 1991–2020 normals, Long Branch-Oakhurst station. -
24Barnegat, New Jersey
July highs average 83.5°F
Barnegat is a community of 3,894 people in Ocean County, New Jersey. January lows average 27.2°F and July highs 83.5°F, with about 10 days a year at 90°F+ and 10 inches of snow.
3,894 people · Ocean County · median home $481,600 · income $108,664 · Jan low 27°F · 10 in snow
Full Barnegat, New Jersey profile: weather, storms, schools, jobs →
NOAA 1991–2020 normals, Brant Beach-Beach Haven station. -
23Oakhurst, New Jersey
July highs average 83.5°F
Oakhurst is a community of 4,069 people in Monmouth County, New Jersey. January lows average 24.8°F and July highs 83.5°F, with about 13 days a year at 90°F+ and 25 inches of snow.
4,069 people · Monmouth County · median home $718,900 · income $145,893 · Jan low 25°F · 25 in snow
Full Oakhurst, New Jersey profile: weather, storms, schools, jobs →
NOAA 1991–2020 normals, Long Branch-Oakhurst station. -
22Beach Haven West, New Jersey
July highs average 83.5°F
Beach Haven West is a community of 4,143 people in Ocean County, New Jersey. January lows average 27.2°F and July highs 83.5°F, with about 10 days a year at 90°F+ and 10 inches of snow.
4,143 people · Ocean County · median home $641,700 · income $119,394 · Jan low 27°F · 10 in snow
Full Beach Haven West, New Jersey profile: weather, storms, schools, jobs →
NOAA 1991–2020 normals, Brant Beach-Beach Haven station. -
21Shrewsbury, New Jersey
July highs average 83.5°F
Shrewsbury is a borough of 4,184 people in Monmouth County, New Jersey. January lows average 24.8°F and July highs 83.5°F, with about 13 days a year at 90°F+ and 26 inches of snow.
4,184 people · Monmouth County · median home $811,400 · income $178,958 · Jan low 25°F · 26 in snow
Full Shrewsbury, New Jersey profile: weather, storms, schools, jobs →
NOAA 1991–2020 normals, Long Branch-Oakhurst station. -
20Bradley Beach, New Jersey
July highs average 83.5°F
Bradley Beach is a borough of 4,282 people in Monmouth County, New Jersey. January lows average 24.8°F and July highs 83.5°F, with about 13 days a year at 90°F+.
4,282 people · Monmouth County · median home $932,800 · income $97,005 · Jan low 25°F
Full Bradley Beach, New Jersey profile: weather, storms, schools, jobs →
NOAA 1991–2020 normals, Long Branch-Oakhurst station. -
19Wanamassa, New Jersey
July highs average 83.5°F
Wanamassa is a community of 4,344 people in Monmouth County, New Jersey. January lows average 24.8°F and July highs 83.5°F, with about 13 days a year at 90°F+ and 25 inches of snow.
4,344 people · Monmouth County · median home $570,100 · income $140,972 · Jan low 25°F · 25 in snow
Full Wanamassa, New Jersey profile: weather, storms, schools, jobs →
NOAA 1991–2020 normals, Long Branch-Oakhurst station. -
18Atlantic Highlands, New Jersey
July highs average 83.5°F
Atlantic Highlands is a borough of 4,414 people in Monmouth County, New Jersey. January lows average 24.8°F and July highs 83.5°F, with about 13 days a year at 90°F+ and 27 inches of snow.
4,414 people · Monmouth County · median home $628,100 · income $126,080 · Jan low 25°F · 27 in snow
Full Atlantic Highlands, New Jersey profile: weather, storms, schools, jobs →
NOAA 1991–2020 normals, Long Branch-Oakhurst station. -
17Highlands, New Jersey
July highs average 83.5°F
Highlands is a borough of 4,621 people in Monmouth County, New Jersey. January lows average 24.8°F and July highs 83.5°F, with about 13 days a year at 90°F+ and 27 inches of snow.
4,621 people · Monmouth County · median home $455,000 · income $91,913 · Jan low 25°F · 27 in snow
Full Highlands, New Jersey profile: weather, storms, schools, jobs →
NOAA 1991–2020 normals, Long Branch-Oakhurst station. -
16Neptune City, New Jersey
July highs average 83.5°F
Neptune City is a borough of 4,626 people in Monmouth County, New Jersey. January lows average 24.8°F and July highs 83.5°F, with about 13 days a year at 90°F+.
4,626 people · Monmouth County · median home $420,700 · income $88,864 · Jan low 25°F
Full Neptune City, New Jersey profile: weather, storms, schools, jobs →
NOAA 1991–2020 normals, Long Branch-Oakhurst station. -
15Spring Lake Heights, New Jersey
July highs average 83.5°F
Spring Lake Heights is a borough of 4,890 people in Monmouth County, New Jersey. January lows average 24.8°F and July highs 83.5°F, with about 13 days a year at 90°F+.
4,890 people · Monmouth County · median home $721,100 · income $106,758 · Jan low 25°F
Full Spring Lake Heights, New Jersey profile: weather, storms, schools, jobs →
NOAA 1991–2020 normals, Long Branch-Oakhurst station. -
14Belmar, New Jersey
July highs average 83.5°F
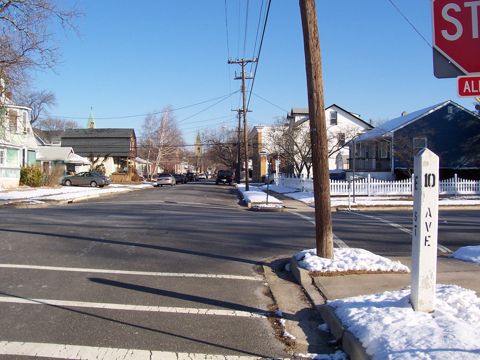
Photo: Gutch220 at English Wikipedia (public domain, Wikimedia Commons) Belmar is a borough of 5,907 people in Monmouth County, New Jersey. January lows average 24.8°F and July highs 83.5°F, with about 13 days a year at 90°F+.
5,907 people · Monmouth County · median home $861,800 · income $93,573 · Jan low 25°F
Full Belmar, New Jersey profile: weather, storms, schools, jobs →
NOAA 1991–2020 normals, Long Branch-Oakhurst station. -
13Manasquan, New Jersey
July highs average 83.5°F
Manasquan is a borough of 5,938 people in Monmouth County, New Jersey. January lows average 24.8°F and July highs 83.5°F, with about 13 days a year at 90°F+.
5,938 people · Monmouth County · median home $988,100 · income $142,944 · Jan low 25°F
Full Manasquan, New Jersey profile: weather, storms, schools, jobs →
NOAA 1991–2020 normals, Long Branch-Oakhurst station. -
12Little Silver, New Jersey
July highs average 83.5°F
Little Silver is a borough of 6,131 people in Monmouth County, New Jersey. January lows average 24.8°F and July highs 83.5°F, with about 13 days a year at 90°F+ and 26 inches of snow.
6,131 people · Monmouth County · median home $955,900 · income $240,853 · Jan low 25°F · 26 in snow
Full Little Silver, New Jersey profile: weather, storms, schools, jobs →
NOAA 1991–2020 normals, Long Branch-Oakhurst station. -
11Oceanport, New Jersey
July highs average 83.5°F
Oceanport is a borough of 6,150 people in Monmouth County, New Jersey. January lows average 24.8°F and July highs 83.5°F, with about 13 days a year at 90°F+ and 26 inches of snow.
6,150 people · Monmouth County · median home $757,700 · income $126,094 · Jan low 25°F · 26 in snow
Full Oceanport, New Jersey profile: weather, storms, schools, jobs →
NOAA 1991–2020 normals, Long Branch-Oakhurst station. -
10Fair Haven, New Jersey
July highs average 83.5°F
Fair Haven is a borough of 6,269 people in Monmouth County, New Jersey. January lows average 24.8°F and July highs 83.5°F, with about 13 days a year at 90°F+ and 27 inches of snow.
6,269 people · Monmouth County · median home $992,200 · income $250,001 · Jan low 25°F · 27 in snow
Full Fair Haven, New Jersey profile: weather, storms, schools, jobs →
NOAA 1991–2020 normals, Long Branch-Oakhurst station. -
9Rumson, New Jersey
July highs average 83.5°F
Rumson is a borough of 7,343 people in Monmouth County, New Jersey. January lows average 24.8°F and July highs 83.5°F, with about 13 days a year at 90°F+ and 27 inches of snow.
7,343 people · Monmouth County · median home $1,679,300 · income $250,001 · Jan low 25°F · 27 in snow
Full Rumson, New Jersey profile: weather, storms, schools, jobs →
NOAA 1991–2020 normals, Long Branch-Oakhurst station. -
8Mystic Island, New Jersey
July highs average 83.5°F
Mystic Island is a community of 8,301 people in Ocean County, New Jersey. January lows average 27.2°F and July highs 83.5°F, with about 10 days a year at 90°F+ and 10 inches of snow.
8,301 people · Ocean County · median home $321,500 · income $78,714 · Jan low 27°F · 10 in snow
Full Mystic Island, New Jersey profile: weather, storms, schools, jobs →
NOAA 1991–2020 normals, Brant Beach-Beach Haven station. -
7West Long Branch, New Jersey
July highs average 83.5°F
West Long Branch is a borough of 8,587 people in Monmouth County, New Jersey. January lows average 24.8°F and July highs 83.5°F, with about 13 days a year at 90°F+ and 26 inches of snow.
8,587 people · Monmouth County · median home $684,300 · income $114,271 · Jan low 25°F · 26 in snow
Full West Long Branch, New Jersey profile: weather, storms, schools, jobs →
NOAA 1991–2020 normals, Long Branch-Oakhurst station. -
6Montague, New Jersey
July highs average 83.2°F
Montague is a township of 3,792 people in Sussex County, New Jersey. January lows average 16.7°F and July highs 83.2°F, with about 13 days a year at 90°F+ and 39 inches of snow.
3,792 people · Sussex County · median home $344,500 · income $101,250 · Jan low 17°F · 39 in snow
Full Montague, New Jersey profile: weather, storms, schools, jobs →
NOAA 1991–2020 normals, Sussex 3 Wnw station. -
5Frankford, New Jersey
July highs average 83.2°F
Frankford is a township of 5,302 people in Sussex County, New Jersey. January lows average 16.7°F and July highs 83.2°F, with about 13 days a year at 90°F+ and 39 inches of snow.
5,302 people · Sussex County · median home $418,400 · income $117,286 · Jan low 17°F · 39 in snow
Full Frankford, New Jersey profile: weather, storms, schools, jobs →
NOAA 1991–2020 normals, Sussex 3 Wnw station. -
4Kinnelon, New Jersey
July highs average 82.9°F
Kinnelon is a borough of 9,966 people in Morris County, New Jersey. January lows average 18.7°F and July highs 82.9°F, with about 10 days a year at 90°F+ and 28 inches of snow.
9,966 people · Morris County · median home $706,400 · income $187,438 · Jan low 19°F · 28 in snow
Full Kinnelon, New Jersey profile: weather, storms, schools, jobs →
NOAA 1991–2020 normals, Charlotteburg Rsvr station. -
3Margate City, New Jersey
July highs average 80.3°F
Margate City is a city of 5,317 people in Atlantic County, New Jersey. January lows average 29.9°F and July highs 80.3°F, with about 6 days a year at 90°F+ and 17 inches of snow.
5,317 people · Atlantic County · median home $708,800 · income $121,800 · Jan low 30°F · 17 in snow
Full Margate City, New Jersey profile: weather, storms, schools, jobs →
NOAA 1991–2020 normals, Atlantic City station. -
2Brigantine, New Jersey
July highs average 80.3°F
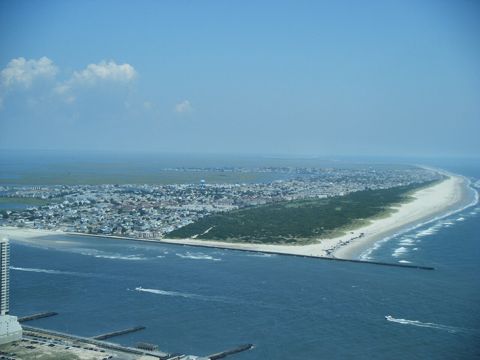
Photo: Dough4872 (public domain, Wikimedia Commons) Brigantine is a city of 7,716 people in Atlantic County, New Jersey. January lows average 29.9°F and July highs 80.3°F, with about 6 days a year at 90°F+ and 15 inches of snow.
7,716 people · Atlantic County · median home $524,800 · income $97,250 · Jan low 30°F · 15 in snow
Full Brigantine, New Jersey profile: weather, storms, schools, jobs →
NOAA 1991–2020 normals, Atlantic City station. -
1Ventnor City, New Jersey
July highs average 80.3°F
Ventnor City is a city of 9,210 people in Atlantic County, New Jersey. January lows average 29.9°F and July highs 80.3°F, with about 6 days a year at 90°F+ and 17 inches of snow.
9,210 people · Atlantic County · median home $363,000 · income $68,671 · Jan low 30°F · 17 in snow
Full Ventnor City, New Jersey profile: weather, storms, schools, jobs →
NOAA 1991–2020 normals, Atlantic City station.
More New Jersey rankings
- The 25 Best Small Towns to Retire in New Jersey
- The 25 Quietest Small Towns in New Jersey
- The 25 Most Affordable Small Towns in New Jersey
- The 25 Best Small Towns for Families in New Jersey
- The 25 Best Quiet, Affordable Small Towns to Retire in New Jersey
- 25 Small Towns in New Jersey With the Cheapest Homes
- 25 Small Towns in New Jersey With the Mildest Winters
- The 25 Most Walkable Small Towns in New Jersey
- 25 Small Towns in New Jersey With the Fewest Tornadoes Since 1950
- The 25 Best Small Towns for First-Time Home Buyers in New Jersey
Same ranking, other places
- 50 Small Towns in America With the Coolest Summers
- 25 Small Towns in Pennsylvania With the Coolest Summers
- 25 Small Towns in New York With the Coolest Summers
- 25 Small Towns in Michigan With the Coolest Summers
- 25 Small Towns in Texas With the Coolest Summers
- 25 Small Towns in California With the Coolest Summers
- U.S. Census Bureau, American Community Survey 5-year estimates (2020–2024)
- U.S. Census Bureau, 2020 Census and 2025 Gazetteer (2020 / 2025)
- NOAA NCEI U.S. Climate Normals (1991–2020)
- NOAA NCEI Storm Events Database (1950–2026)
- FEMA OpenFEMA Disaster Declarations (this product uses the FEMA OpenFEMA API but is not endorsed by FEMA) (1953–2026)
- NCES Common Core of Data (2023–24)
- BLS Quarterly Census of Employment and Wages; USDA ERS county unemployment (BLS LAUS) (2000–2024)
- The Town Files lifestyle rankings, built from federal demographic, school, crime and housing data (2025)