 The Town Files
25 Small Towns in Texas With the Coolest Summers
Ranked by july average high (°f) among 364 towns of 500–10,000 people in Texas. #1 is Ingleside, TX (July highs average 88.0°F).
-
25Palacios, Texas
July highs average 91.7°F
Palacios is a city of 4,395 people in Matagorda County, Texas. January lows average 46.0°F and July highs 91.7°F, with about 82 days a year at 90°F+ and 0 inches of snow.
4,395 people · Matagorda County · median home $153,800 · income $52,620 · Jan low 46°F · 0 in snow
Full Palacios, Texas profile: weather, storms, schools, jobs →
NOAA 1991–2020 normals, Palacios Muni Ap station. -
24Muleshoe, Texas
July highs average 91.6°F
Muleshoe is a city of 5,160 people in Bailey County, Texas. January lows average 20.0°F and July highs 91.6°F, with about 78 days a year at 90°F+ and 8 inches of snow.
5,160 people · Bailey County · median home $98,600 · income $69,097 · Jan low 20°F · 8 in snow
Full Muleshoe, Texas profile: weather, storms, schools, jobs →
NOAA 1991–2020 normals, Muleshoe #1 station. -
23Crosby, Texas
July highs average 91.5°F
Crosby is a community of 3,417 people in Harris County, Texas. January lows average 41.4°F and July highs 91.5°F, with about 84 days a year at 90°F+ and 0 inches of snow.
3,417 people · Harris County · median home $226,700 · income $59,241 · Jan low 41°F · 0 in snow
Full Crosby, Texas profile: weather, storms, schools, jobs →
NOAA 1991–2020 normals, Baytown station. -
22Barrett, Texas
July highs average 91.5°F
Barrett is a community of 5,223 people in Harris County, Texas. January lows average 41.4°F and July highs 91.5°F, with about 84 days a year at 90°F+ and 0 inches of snow.
5,223 people · Harris County · median home $190,000 · income $48,125 · Jan low 41°F · 0 in snow
Full Barrett, Texas profile: weather, storms, schools, jobs →
NOAA 1991–2020 normals, Baytown station. -
21Mont Belvieu, Texas
July highs average 91.5°F
Mont Belvieu is a city of 7,654 people in Chambers County, Texas. January lows average 41.4°F and July highs 91.5°F, with about 84 days a year at 90°F+ and 0 inches of snow.
7,654 people · Chambers County · median home $411,000 · income $132,781 · Jan low 41°F · 0 in snow
Full Mont Belvieu, Texas profile: weather, storms, schools, jobs →
NOAA 1991–2020 normals, Baytown station. -
20Highlands, Texas
July highs average 91.5°F
Highlands is a community of 8,612 people in Harris County, Texas. January lows average 41.4°F and July highs 91.5°F, with about 84 days a year at 90°F+ and 0 inches of snow.
8,612 people · Harris County · median home $214,400 · income $52,167 · Jan low 41°F · 0 in snow
Full Highlands, Texas profile: weather, storms, schools, jobs →
NOAA 1991–2020 normals, Baytown station. -
19Dayton, Texas
July highs average 91.5°F
Dayton is a city of 8,777 people in Liberty County, Texas. January lows average 41.4°F and July highs 91.5°F, with about 84 days a year at 90°F+ and 0 inches of snow.
8,777 people · Liberty County · median home $227,600 · income $59,691 · Jan low 41°F · 0 in snow
Full Dayton, Texas profile: weather, storms, schools, jobs →
NOAA 1991–2020 normals, Baytown station. -
18Cleveland, Texas
July highs average 91.4°F
Cleveland is a city of 7,471 people in Liberty County, Texas. January lows average 38.9°F and July highs 91.4°F, with about 88 days a year at 90°F+ and 0 inches of snow.
7,471 people · Liberty County · median home $174,400 · income $54,519 · Jan low 39°F · 0 in snow
Full Cleveland, Texas profile: weather, storms, schools, jobs →
NOAA 1991–2020 normals, Cleveland station. -
17Hitchcock, Texas
July highs average 91.3°F
Hitchcock is a city of 7,301 people in Galveston County, Texas. January lows average 48.9°F and July highs 91.3°F, with about 66 days a year at 90°F+ and 0 inches of snow.
7,301 people · Galveston County · median home $188,300 · income $74,157 · Jan low 49°F · 0 in snow
Full Hitchcock, Texas profile: weather, storms, schools, jobs →
NOAA 1991–2020 normals, Galveston Scholes Fld station. -
16Friona, Texas
July highs average 91.2°F
Friona is a city of 4,171 people in Parmer County, Texas. January lows average 22.4°F and July highs 91.2°F, with about 69 days a year at 90°F+ and 13 inches of snow.
4,171 people · Parmer County · median home $125,500 · income $66,801 · Jan low 22°F · 13 in snow
Full Friona, Texas profile: weather, storms, schools, jobs →
NOAA 1991–2020 normals, Friona station. -
15Tulia, Texas
July highs average 91.1°F
Tulia is a city of 4,473 people in Swisher County, Texas. January lows average 22.7°F and July highs 91.1°F, with about 74 days a year at 90°F+ and 11 inches of snow.
4,473 people · Swisher County · median home $81,100 · income $32,288 · Jan low 23°F · 11 in snow
NOAA 1991–2020 normals, Tulia station. -
14Laguna Vista, Texas
July highs average 91.0°F
Laguna Vista is a town of 3,520 people in Cameron County, Texas. January lows average 51.7°F and July highs 91.0°F, with about 95 days a year at 90°F+ and 0 inches of snow.
3,520 people · Cameron County · median home $255,900 · income $63,632 · Jan low 52°F · 0 in snow
Full Laguna Vista, Texas profile: weather, storms, schools, jobs →
NOAA 1991–2020 normals, Port Isabel station. -
13West Columbia, Texas
July highs average 91.0°F
West Columbia is a city of 3,644 people in Brazoria County, Texas. January lows average 46.8°F and July highs 91.0°F, with about 83 days a year at 90°F+ and 0 inches of snow.
3,644 people · Brazoria County · median home $140,800 · income $43,490 · Jan low 47°F · 0 in snow
Full West Columbia, Texas profile: weather, storms, schools, jobs →
NOAA 1991–2020 normals, Angleton 2 W station. -
12Port Isabel, Texas
July highs average 91.0°F

Photo: lfwlfw / Bevo at English Wikipedia (public domain, Wikimedia Commons) Port Isabel is a city of 5,028 people in Cameron County, Texas. January lows average 51.7°F and July highs 91.0°F, with about 95 days a year at 90°F+ and 0 inches of snow.
5,028 people · Cameron County · median home $182,600 · income $32,222 · Jan low 52°F · 0 in snow
Full Port Isabel, Texas profile: weather, storms, schools, jobs →
NOAA 1991–2020 normals, Port Isabel station. -
11Alpine, Texas
July highs average 90.8°F
Alpine is a city of 6,035 people in Brewster County, Texas. January lows average 31.3°F and July highs 90.8°F, with about 82 days a year at 90°F+ and 2 inches of snow.
6,035 people · Brewster County · median home $219,800 · income $60,139 · Jan low 31°F · 2 in snow
Full Alpine, Texas profile: weather, storms, schools, jobs →
NOAA 1991–2020 normals, Alpine station. -
10Bolivar Peninsula, Texas
July highs average 90.7°F
Bolivar Peninsula is a community of 2,769 people in Galveston County, Texas. January lows average 43.2°F and July highs 90.7°F, with about 68 days a year at 90°F+ and 0 inches of snow.
2,769 people · Galveston County · median home $315,500 · income $75,547 · Jan low 43°F · 0 in snow
Full Bolivar Peninsula, Texas profile: weather, storms, schools, jobs →
NOAA 1991–2020 normals, Anahuac station. -
9Abernathy, Texas
July highs average 90.7°F
Abernathy is a city of 2,865 people in Hale County, Texas. January lows average 24.4°F and July highs 90.7°F, with about 73 days a year at 90°F+ and 7 inches of snow.
2,865 people · Hale County · median home $176,400 · income $87,531 · Jan low 24°F · 7 in snow
Full Abernathy, Texas profile: weather, storms, schools, jobs →
NOAA 1991–2020 normals, Abernathy station. -
8Winnie, Texas
July highs average 90.7°F
Winnie is a community of 3,162 people in Chambers County, Texas. January lows average 43.2°F and July highs 90.7°F, with about 68 days a year at 90°F+ and 0 inches of snow.
3,162 people · Chambers County · median home $166,500 · income $80,913 · Jan low 43°F · 0 in snow
Full Winnie, Texas profile: weather, storms, schools, jobs →
NOAA 1991–2020 normals, Anahuac station. -
7Beach City, Texas
July highs average 90.7°F
Beach City is a city of 3,221 people in Chambers County, Texas. January lows average 43.2°F and July highs 90.7°F, with about 68 days a year at 90°F+ and 0 inches of snow.
3,221 people · Chambers County · median home $496,900 · income $148,574 · Jan low 43°F · 0 in snow
Full Beach City, Texas profile: weather, storms, schools, jobs →
NOAA 1991–2020 normals, Anahuac station. -
6Rusk, Texas
July highs average 90.7°F
Rusk is a city of 5,285 people in Cherokee County, Texas. January lows average 37.3°F and July highs 90.7°F, with about 69 days a year at 90°F+ and 0 inches of snow.
5,285 people · Cherokee County · median home $157,400 · income $53,438 · Jan low 37°F · 0 in snow
NOAA 1991–2020 normals, Rusk station. -
5Mauriceville, Texas
July highs average 89.9°F
Mauriceville is a community of 2,983 people in Orange County, Texas. January lows average 40.3°F and July highs 89.9°F, with about 74 days a year at 90°F+ and 0 inches of snow.
2,983 people · Orange County · median home $179,600 · income $64,167 · Jan low 40°F · 0 in snow
Full Mauriceville, Texas profile: weather, storms, schools, jobs →
NOAA 1991–2020 normals, Orange 9 N station. -
4West Orange, Texas
July highs average 89.9°F
West Orange is a city of 3,459 people in Orange County, Texas. January lows average 40.3°F and July highs 89.9°F, with about 74 days a year at 90°F+ and 0 inches of snow.
3,459 people · Orange County · median home $110,700 · income $60,323 · Jan low 40°F · 0 in snow
Full West Orange, Texas profile: weather, storms, schools, jobs →
NOAA 1991–2020 normals, Orange 9 N station. -
3Port Aransas, Texas
July highs average 88.0°F
Port Aransas is a city of 2,904 people in Nueces County, Texas. January lows average 50.4°F and July highs 88.0°F, with about 57 days a year at 90°F+ and 0 inches of snow.
2,904 people · Nueces County · median home $588,700 · income $88,947 · Jan low 50°F · 0 in snow
Full Port Aransas, Texas profile: weather, storms, schools, jobs →
NOAA 1991–2020 normals, Port Aransas station. -
2Aransas Pass, Texas
July highs average 88.0°F
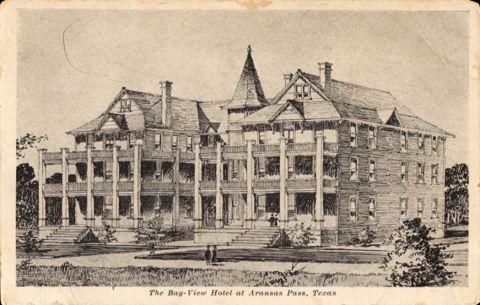
Photo: The University of Houston Digital Library (public domain, Wikimedia Commons) Aransas Pass is a city of 7,941 people in San Patricio County, Texas. January lows average 50.4°F and July highs 88.0°F, with about 57 days a year at 90°F+ and 0 inches of snow.
7,941 people · San Patricio County · median home $235,500 · income $63,021 · Jan low 50°F · 0 in snow
Full Aransas Pass, Texas profile: weather, storms, schools, jobs →
NOAA 1991–2020 normals, Port Aransas station. -
1Ingleside, Texas
July highs average 88.0°F
Ingleside is a city of 9,519 people in San Patricio County, Texas. January lows average 50.4°F and July highs 88.0°F, with about 57 days a year at 90°F+ and 0 inches of snow.
9,519 people · San Patricio County · median home $189,200 · income $69,464 · Jan low 50°F · 0 in snow
Full Ingleside, Texas profile: weather, storms, schools, jobs →
NOAA 1991–2020 normals, Port Aransas station.
More Texas rankings
- The 25 Best Small Towns to Retire in Texas
- The 25 Quietest Small Towns in Texas
- The 25 Most Affordable Small Towns in Texas
- The 25 Best Small Towns for Families in Texas
- The 25 Best Quiet, Affordable Small Towns to Retire in Texas
- 25 Small Towns in Texas With the Cheapest Homes
- 25 Small Towns in Texas With the Mildest Winters
- The 25 Most Walkable Small Towns in Texas
- 25 Small Towns in Texas With the Fewest Tornadoes Since 1950
- The 25 Best Small Towns for First-Time Home Buyers in Texas
Same ranking, other places
- 50 Small Towns in America With the Coolest Summers
- 25 Small Towns in Pennsylvania With the Coolest Summers
- 25 Small Towns in New York With the Coolest Summers
- 25 Small Towns in Michigan With the Coolest Summers
- 25 Small Towns in California With the Coolest Summers
- 25 Small Towns in New Jersey With the Coolest Summers
- U.S. Census Bureau, American Community Survey 5-year estimates (2020–2024)
- U.S. Census Bureau, 2020 Census and 2025 Gazetteer (2020 / 2025)
- NOAA NCEI U.S. Climate Normals (1991–2020)
- NOAA NCEI Storm Events Database (1950–2026)
- FEMA OpenFEMA Disaster Declarations (this product uses the FEMA OpenFEMA API but is not endorsed by FEMA) (1953–2026)
- NCES Common Core of Data (2023–24)
- BLS Quarterly Census of Employment and Wages; USDA ERS county unemployment (BLS LAUS) (2000–2024)
- The Town Files lifestyle rankings, built from federal demographic, school, crime and housing data (2025)